Risk profiles
Risk accompanies
investments. ZZAlpha can generate Risk Profiles for
all its portfolios to help investors understand risks
associated with the recommendations.
No one number or graph captures the notions of risk and the likelihood of profit. We use simple statistics and graphs.
The following are some of the contents of a typical ZZAlpha® risk profile (shown here for the SP500 Long portfolio for the study period Jan 2013-Dec 2017).
No one number or graph captures the notions of risk and the likelihood of profit. We use simple statistics and graphs.
The following are some of the contents of a typical ZZAlpha® risk profile (shown here for the SP500 Long portfolio for the study period Jan 2013-Dec 2017).
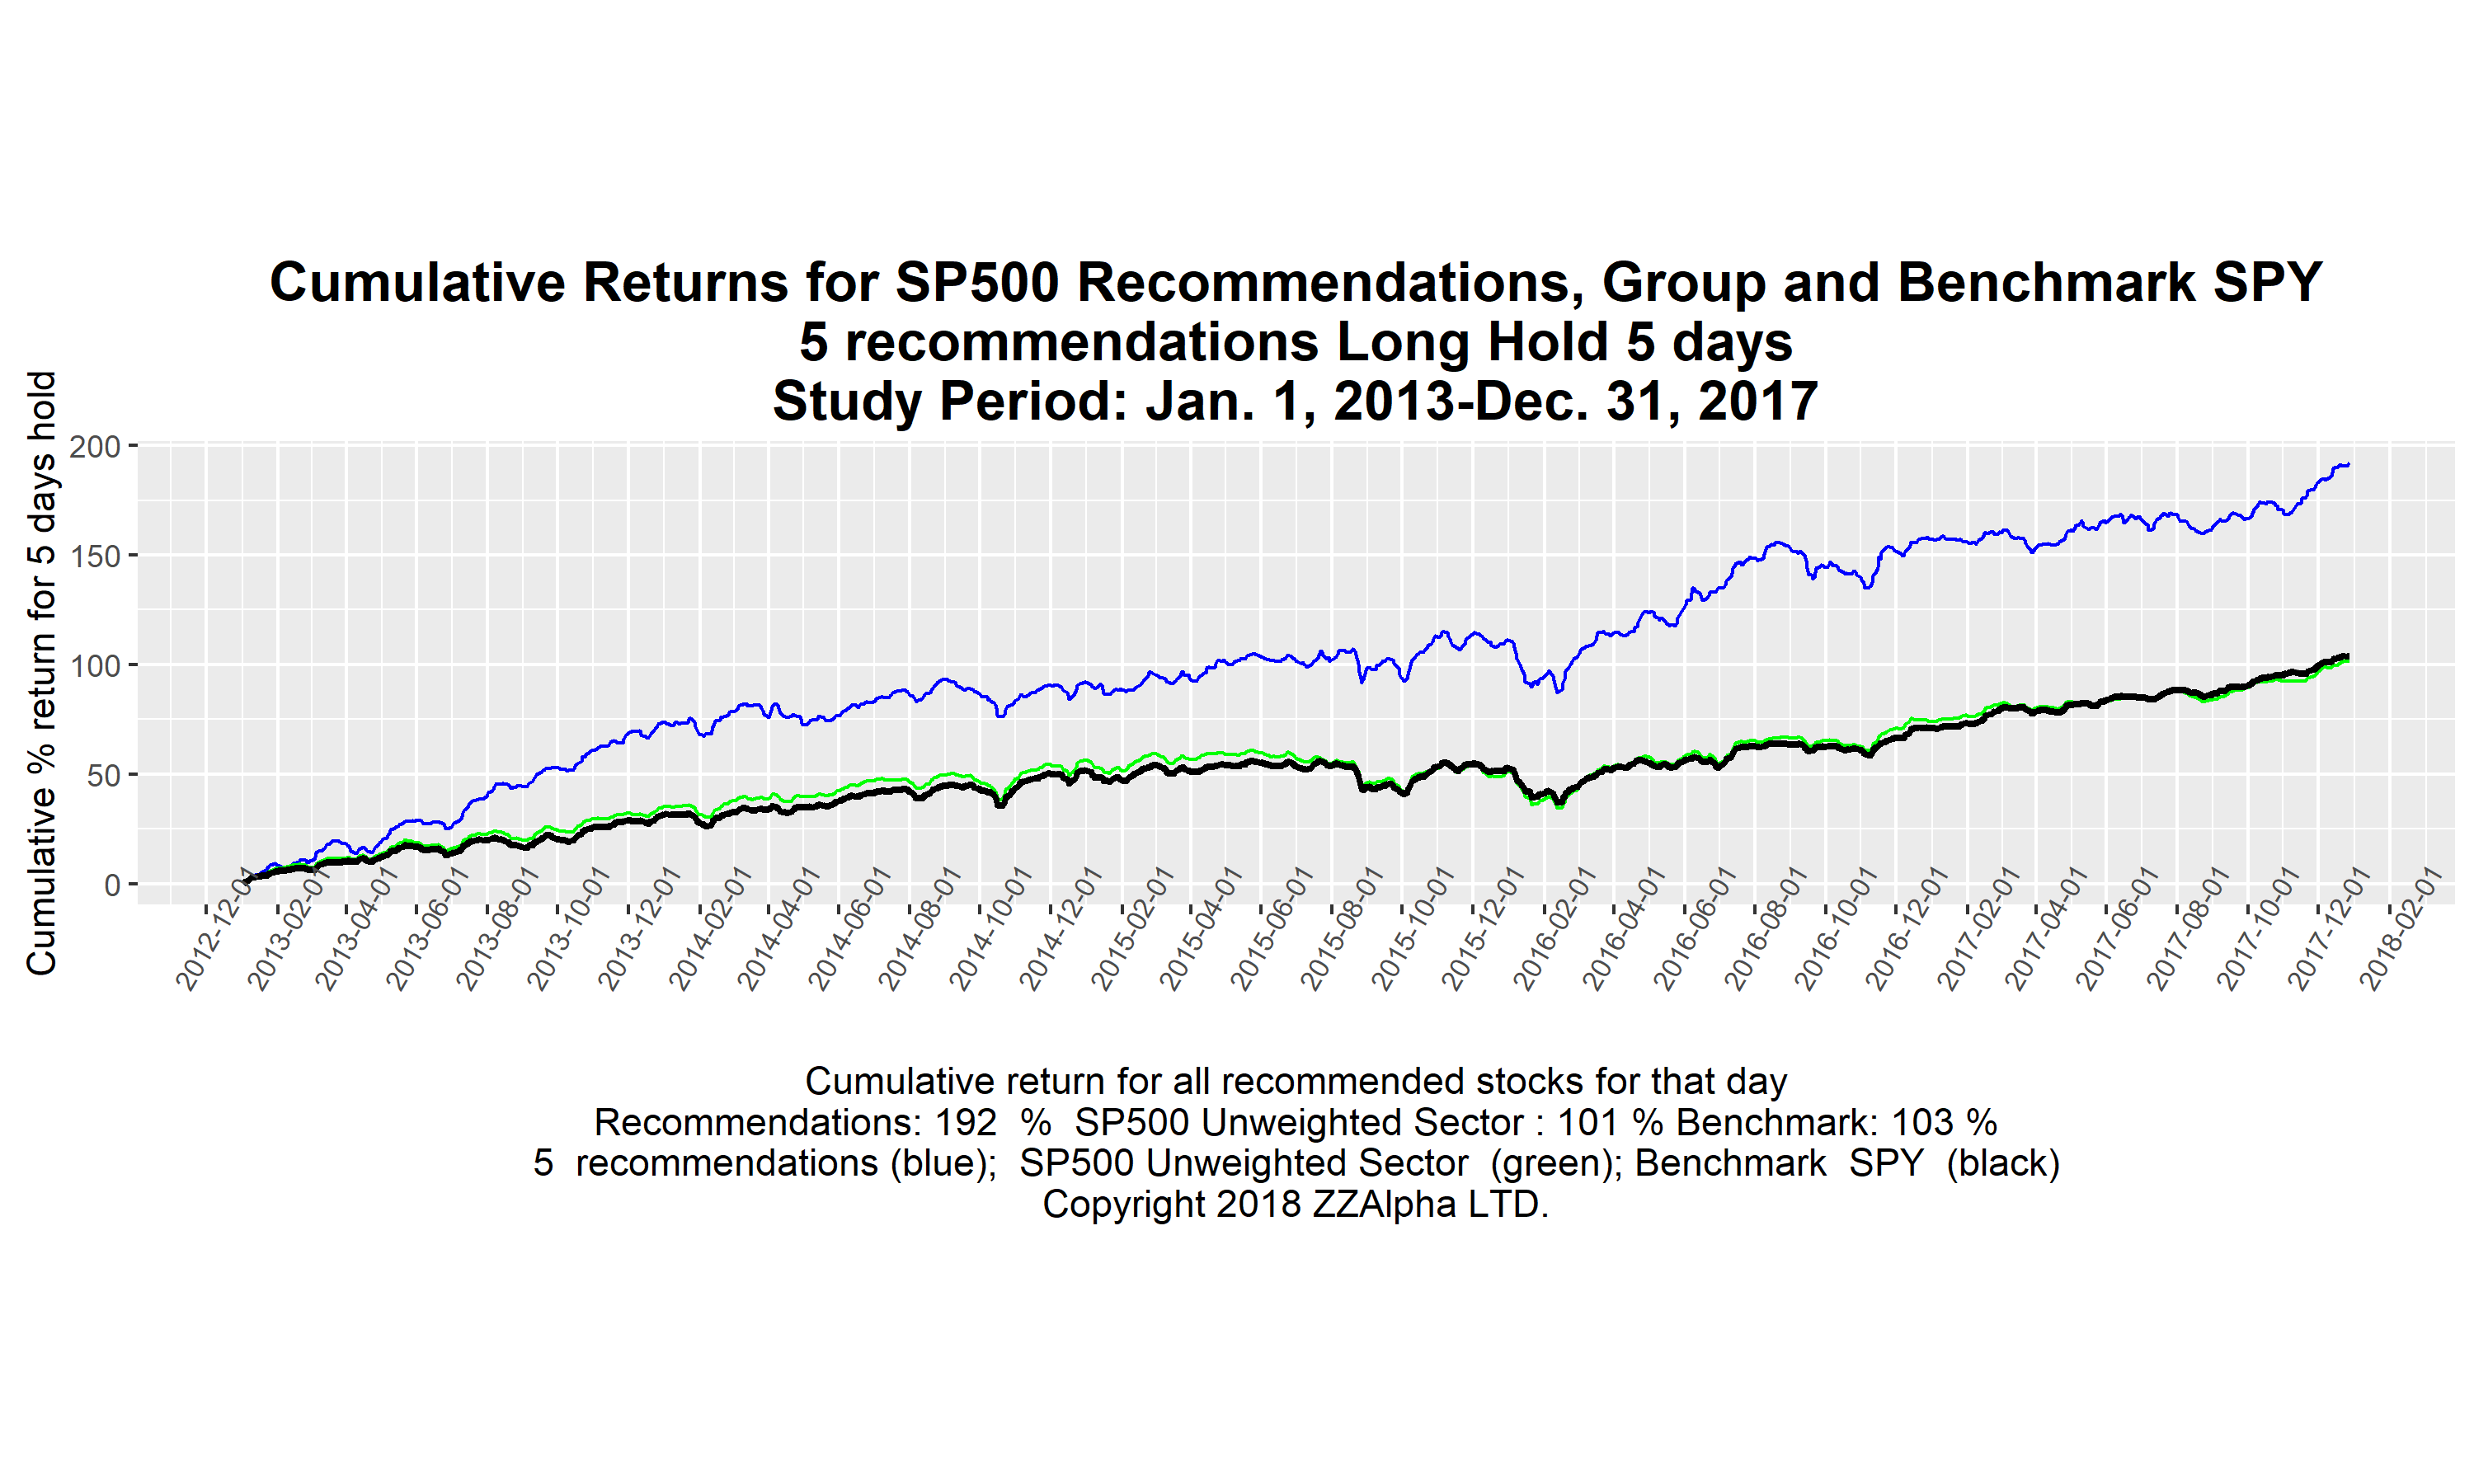
The graph above shows the cumulative values over the 5 years 2013-2017. The periods when the line drops below a point to the left on the line are "drawdown" risk periods - - the value of a recommendation portfolio is less than it was sometime earlier. The deepest risk period for the blue line was the about Nov 15, 2012 and about Jan 15, 2016. The length in months of those risk periods is about 2 months.
We can also produce advanced graphs of many aspects of a portfolio. For example:
- The daily range of results of the five daily recommendations.
- Cumulative performance since 2006 that adds context, and deeper and longer risk in the 2008-2009 recession, mid 2011 and late 2018.
- Capitalization participation. Sector, SIC group
and Index Group portfolios represents a range of
capitalizations. Because the market acts
differently with different size companies, risk
evaluation involves understanding what size companies
are performing in a portfolio.
- Concentration of recommendations among all the tickers in the SP500 This graph confirms that recommendations are not concentrated in only a few stocks.
- Variation in the size of firms being recommended over time. Smaller companies in the SP500 were recommended more commonly in the early part of 2012-2016.
- Market sector exposure: For a portfolio such as the SP500, concentrated exposure to different market sectors can create risk. We graph a timeline for the exposure to sectors over the study period.
Further examples of our advanced analysis and visualizations of portfolio attributes are shown in our papers presented at the leading Knowledge Discovery and Data Mining Conferences. See.